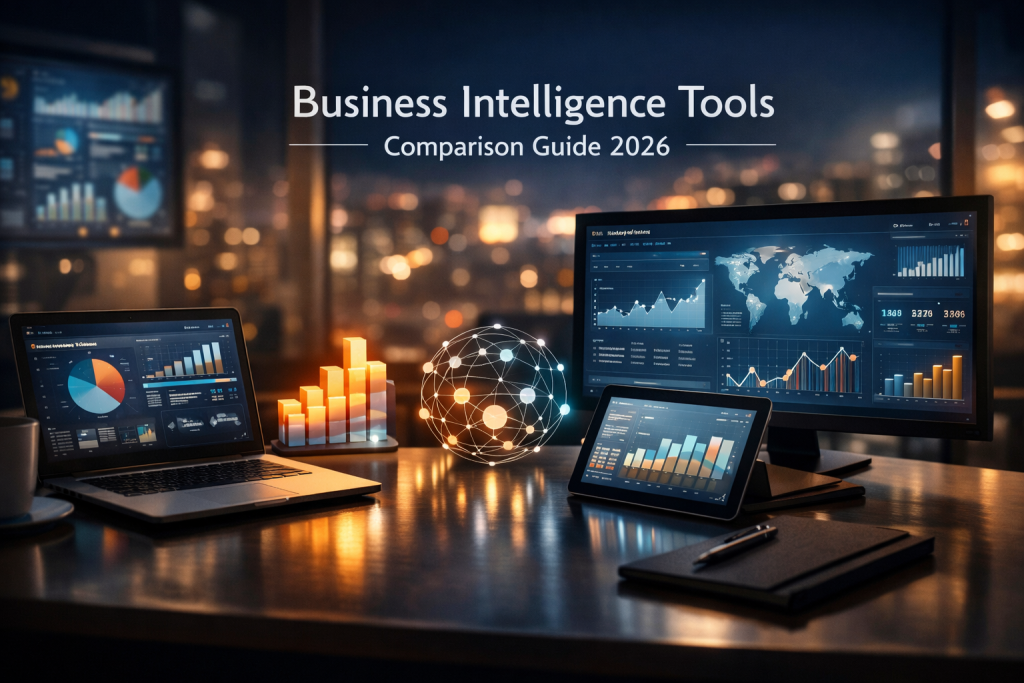
Business Intelligence Tools Comparison Guide 2026
Organizations evaluating analytics platforms in 2026 are not looking for generic feature lists. They need clarity on scalability, governance, cost structure, AI capabilities, and integration depth. A structured business intelligence tools comparison helps decision-makers align technical capabilities with operational goals, risk tolerance, and data maturity level. This guide outlines the critical factors and compares leading platforms based on real-world enterprise requirements.
What Defines a Modern Business Intelligence Platform in 2026
A modern BI platform is no longer limited to dashboards. It combines data integration, transformation, visualization, predictive analytics, and AI-assisted insights within a unified environment. Tools must support hybrid and multi-cloud architectures while maintaining governance controls.
Self-service analytics is now expected, but it must coexist with centralized data governance. Business users demand drag-and-drop simplicity, while data teams require semantic modeling, role-based access control, and audit trails. A proper business intelligence tools comparison evaluates how well each platform balances usability with control.
Embedded analytics has also become standard. Organizations increasingly integrate BI directly into customer portals, SaaS products, and internal systems. Platforms that provide strong APIs and white-label capabilities score higher in long-term flexibility.
Finally, AI integration distinguishes modern tools. Automated insight generation, anomaly detection, natural language queries, and predictive modeling are now baseline expectations rather than premium add-ons.
Comparison Criteria: Core Dimensions That Matter
An effective business intelligence tools comparison begins with evaluation criteria. Without clear metrics, feature comparisons become superficial.
1. Data Connectivity and Integration Leading platforms support hundreds of native connectors for databases, cloud warehouses, APIs, and flat files. The difference lies in real-time streaming support, data refresh performance, and transformation capabilities within the tool. 2. Scalability and Performance Enterprise-grade tools handle billions of rows with optimized in-memory engines or direct-query modes. Performance tuning, caching strategies, and distributed computing capabilities separate mid-tier tools from enterprise solutions. 3. Visualization and User Experience Visualization flexibility affects adoption. Advanced tools offer customizable dashboards, interactive filtering, drill-down capabilities, and responsive design for mobile devices. 4. Governance and Security Security features include row-level security, role-based access control, data lineage tracking, and compliance support. In regulated industries, this category often determines platform selection. 5. AI and Advanced Analytics Built-in machine learning integration, automated insights, and natural language processing reduce reliance on data scientists. Tools with seamless AI augmentation improve speed-to-insight. 6. Pricing and Total Cost of Ownership Licensing models vary widely. Some charge per user, others per capacity or compute usage. Infrastructure costs, training requirements, and administrative overhead must be considered in any realistic comparison.
Leading Business Intelligence Tools in 2026
The BI market remains competitive, with a few dominant players and several specialized challengers. Each tool excels in different operational contexts.
Microsoft Power BI remains strong due to its integration with the Microsoft ecosystem. It offers robust modeling through Power Query and DAX, competitive pricing, and strong enterprise governance. Its scalability through Fabric and Azure integration makes it suitable for mid-size to large enterprises. Tableau focuses heavily on advanced visualization and intuitive exploration. It excels in visual storytelling and complex dashboard interactivity. Enterprises that prioritize design and analytics flexibility often favor Tableau, especially when integrated with Salesforce infrastructure. Qlik Sense differentiates itself with its associative data model. Users can explore data without predefined query paths, enabling deeper insight discovery. It is well-suited for organizations needing flexible data exploration beyond traditional dashboard constraints. Looker (Google Cloud) emphasizes centralized data modeling with LookML. It performs well in cloud-native environments, particularly with BigQuery. Companies prioritizing governed metrics and scalable semantic layers often prefer Looker. SAP Analytics Cloud integrates tightly with SAP ERP environments. It combines BI, planning, and predictive capabilities within a single interface. Enterprises operating within SAP ecosystems benefit from streamlined data integration.
In any business intelligence tools comparison, context determines superiority. No platform universally outperforms others across all categories.
Deployment Models and Infrastructure Considerations
Deployment architecture significantly impacts long-term efficiency. Organizations must choose between cloud-native, hybrid, and on-premise models.
Cloud-native BI platforms provide elasticity and automatic updates. They reduce infrastructure maintenance but may introduce recurring subscription costs and dependency on vendor ecosystems.
Hybrid models allow sensitive data to remain on-premise while leveraging cloud scalability for analytics workloads. This approach suits industries with strict compliance requirements.
On-premise deployments offer maximum control but require higher maintenance resources. Infrastructure scaling and hardware upgrades increase operational complexity.
A structured business intelligence tools comparison should evaluate how each vendor supports migration flexibility. Tools that allow smooth transitions between deployment models reduce long-term risk.
Self-Service vs. Centralized Governance Balance
Self-service analytics empowers business teams to create dashboards without IT bottlenecks. However, uncontrolled self-service leads to inconsistent metrics and duplicated reports.
Enterprise-grade platforms address this by implementing semantic layers and certified datasets. These frameworks ensure standardized KPIs while maintaining user flexibility.

Data governance features such as lineage tracking and usage analytics help administrators monitor adoption. Platforms with strong governance capabilities reduce reporting errors and compliance exposure.
The ideal balance depends on organizational maturity. Early-stage companies may prioritize agility, while regulated enterprises emphasize control and traceability.
AI, Automation, and the Future of BI
Artificial intelligence has reshaped expectations in analytics. Modern BI platforms incorporate natural language queries, automated anomaly detection, and predictive forecasting models.
Augmented analytics reduces manual effort. Instead of manually searching for patterns, users receive automated insight recommendations. This accelerates executive decision-making cycles.
Integration with external machine learning frameworks is also critical. Tools that connect seamlessly with Python, R, or cloud ML services provide advanced modeling flexibility.
In 2026, competitive differentiation increasingly depends on AI maturity. Platforms that treat AI as an integrated layer rather than an add-on provide stronger long-term value.
Cost Structure and ROI Evaluation
Cost evaluation extends beyond licensing fees. Infrastructure scaling, data storage, user training, and administrative management contribute to total cost of ownership.
Per-user licensing may seem affordable initially but becomes expensive at enterprise scale. Capacity-based pricing can offer better scalability but requires accurate forecasting.
Return on investment depends on adoption rates and decision velocity improvements. Tools that reduce reporting turnaround time and improve forecasting accuracy generate measurable operational gains.
A rigorous business intelligence tools comparison should include scenario-based financial modeling rather than simple price comparisons.
Conclusion
A comprehensive business intelligence tools comparison in 2026 requires structured evaluation across scalability, governance, AI capability, deployment flexibility, and cost efficiency. No single platform fits all organizations. The correct choice depends on infrastructure strategy, data maturity, compliance requirements, and long-term analytics goals.
FAQ
Q: What is the most important factor in a business intelligence tools comparison? A: Alignment with organizational data architecture and governance requirements typically outweighs individual feature differences.
Q: Which BI tool is best for cloud-native environments? A: Looker and Power BI integrated with cloud services are commonly preferred for scalable cloud-native deployments.
Q: Are AI features necessary in modern BI tools? A: Yes, AI-driven insights and automation significantly improve decision speed and analytical depth.
Q: How do pricing models differ among BI platforms? A: Vendors typically use per-user, per-capacity, or usage-based pricing models, each affecting scalability costs differently.
Q: Can small businesses use enterprise BI platforms effectively? A: Yes, but they must evaluate cost, complexity, and administrative overhead to ensure sustainable adoption.
